Yavapai County is now in Congressional District 2. The Democratic candidate for the U. S House of Representatives is Eli Crane.
The entirety of Yavapai County are now in Arizona Legislative District 1. We are no longer split between districts. Our representatives are Ken Bennett, Senate and Selena Bliss and Quang Nuygen, House.

Population
Total Population: 794,612
Total Voting Age Population: 628,519
Target Deviation (Total): 1
Target Deviation (%): 0.00%
Demographics
Total Citizen VAP: 593,135
Hispanic CVAP (%): 13.68%
Non-Hispanic Native American Single-Race CVAP (%): 20.70%
Non-Hispanic American Indian/Alaskan Native CVAP (Total): 115,094
Non-Hispanic American Indian/Alaskan Native CVAP (%): 18.31%
Competitive Data Analysis
Vote Spread: 7.20%
Leaning: Republican
Competitiveness: Outside of Competitive Range
Votes for Dem. Candidates (%): 46.40%
Votes for Rep. Candidates (%): 53.60%
2020 Presidential Election (%): 45.95%
2018 Governor (%): 40.02%
2018 Attorney General (%): 45.31%
Note: Allowable Target Population Deviation percentage for Congressional plans are +/- 1% and +/- 5% for Legislative plans.
Vote Spread Defined: Difference between average Democratic and average Republican votes in 9 state elections. All percentages for elections are shown as Democratic percentages meaning the 0-49% range is Republican Leaning and 51-100% is Democratic Leaning. A "Highly Competitive" district is seen as having a 4% spread or less. A "Competitive" district is seen as having a range between 4% and 7%.
Citizen Voting Age Population (CVAP) is the total population age 18 and over and a citizen. (Related to VAP) (CVAP and VAP should not be used for re-districting and could be subject to legal challenges.)
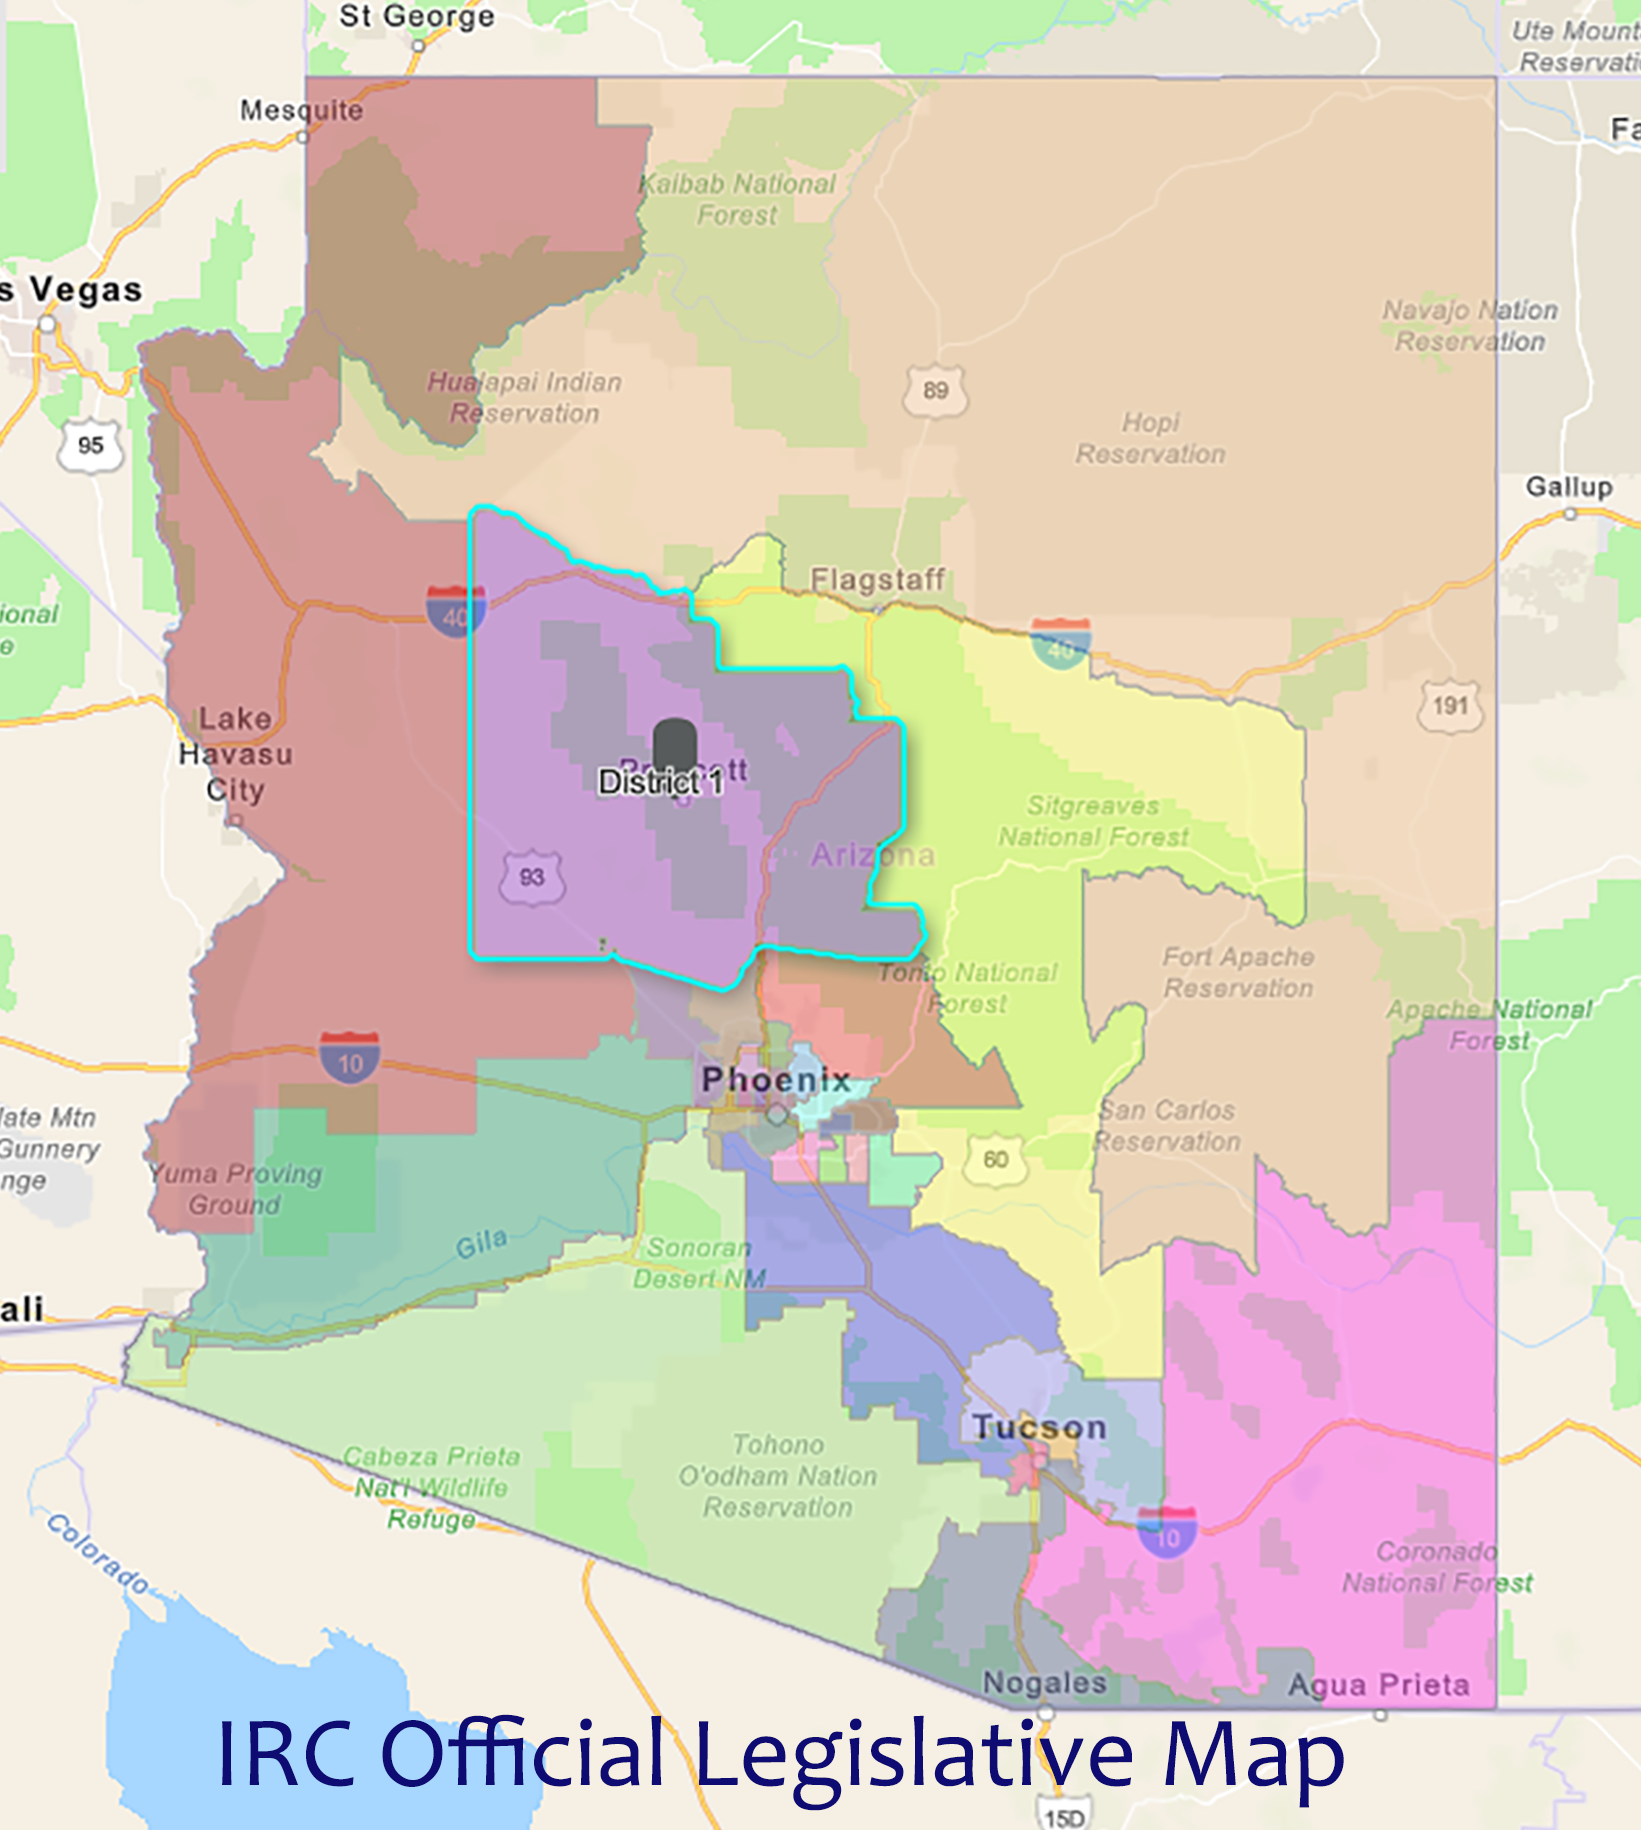
Approved Official Legislative Map: D1
Population
Total Population: 237,896
Total Voting Age Population: 200,724
Target Deviation (Total): -487
Target Deviation (%): -0.20%
Demographics
Total Citizen VAP: 186,039
Hispanic CVAP (%): 10%
Non-Hispanic Native American Single-Race CVAP (%): 2.01%
Non-Hispanic American Indian/Alaskan Native CVAP (Total): 2,473
Non-Hispanic American Indian/Alaskan Native CVAP (%): 1.23%
Competitive Data Analysis
Vote Spread: 27.78%
Leaning: Republican
Competitiveness: Outside of Competitive Range
Votes for Dem. Candidates (%): 36.11%
Votes for Rep. Candidates (%): 63.89%
2020 Presidential Election (%): 35.45%
2018 Governor (%): 30.62%
2018 Attorney General (%): 35.39%
Note: Allowable Target Population Deviation percentage for Congressional plans are +/- 1% and +/- 5% for Legislative plans.
Vote Spread Defined: Difference between average Democratic and average Republican votes in 9 state elections. All percentages for elections are shown as Democratic percentages meaning the 0-49% range is Republican Leaning and 51-100% is Democratic Leaning. A "Highly Competitive" district is seen as having a 4% spread or less. A "Competitive" district is seen as having a range between 4% and 7%.